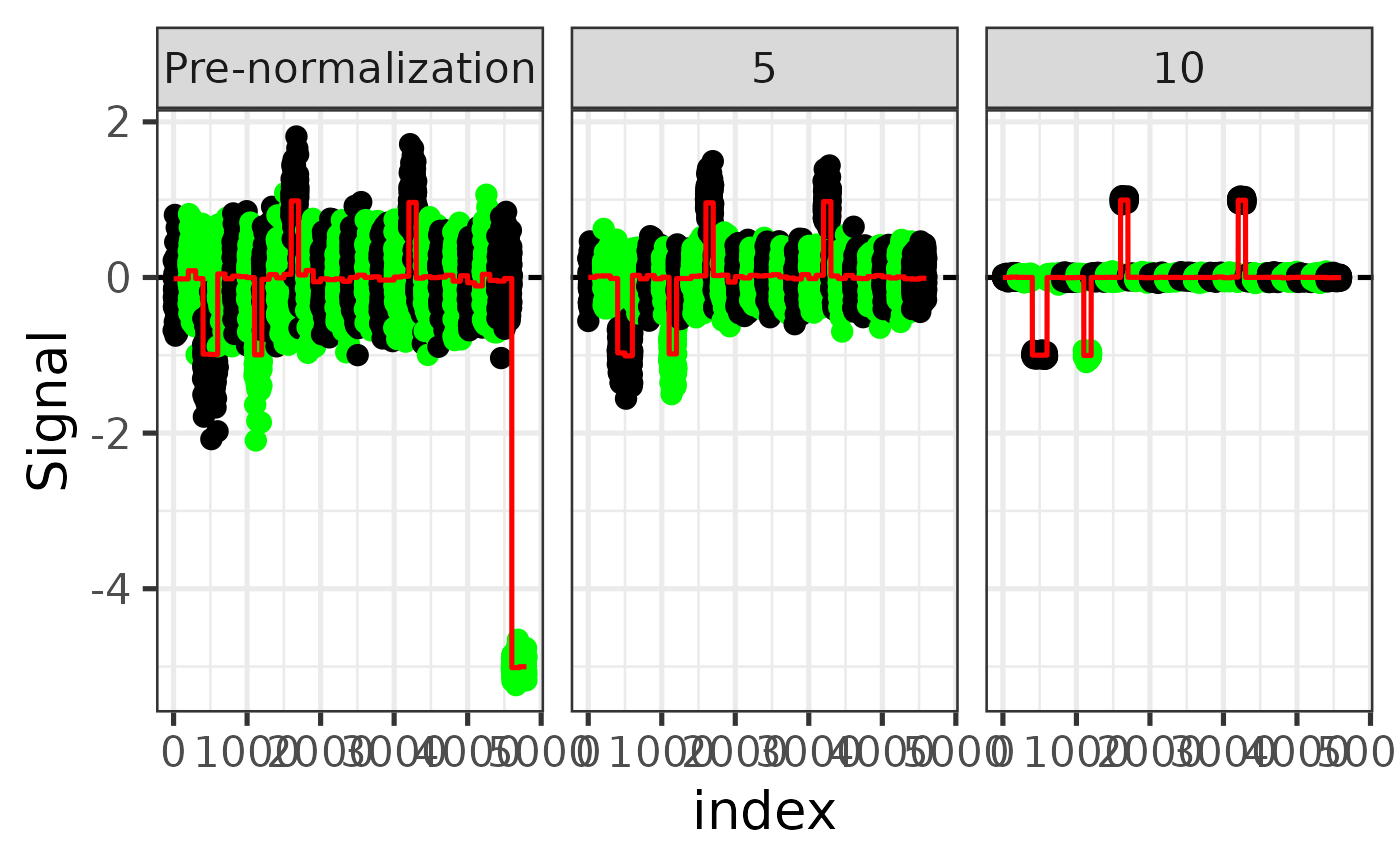
Plot signal along genome before and after TangentXY normalization
plot_signal_along_loci.RdPlot signal along genome before and after TangentXY normalization
Arguments
- tnorm
A normalized tumor signal matrix output by
run_tangent, or a list of such matrices.- sample_id
Sample ID to plot
- pif_df
Tibble or filepath to a text file containing probe information. Should have a 'chr' column with chromosome names (1-22, X, Y) and an 'arm' column with arm names (p or q)
- tsig_df
Tibble or filepath to a text file containing the tumor signal matrix
- n_latent
A numeric vector of the numbers of latent factors used in TangentXY normalization. Should correspond to the elements in
tnorm.- output_dir
Directory to save the plot. If
NULL, the plot will be printed to the screen.
Value
(Invisibly) A ggplot object containing the signal profiles for the sample before and after normalization.
Examples
n_latent <- c(5, 10)
tangent_res <- lapply(n_latent, function(nlf) {
  run_tangent(example_sif, example_nsig_df, example_tsig_df, nlf, make_plots = FALSE)
})
#>
#> Applying linear transformation ...
#>
#> Running SVD ...
#>
#> Running Tangent on autosomes and chrX ...
#> Done.
#>
#> Running Tangent on male chrY ...
#> Done.
#>
#> Applying linear transformation ...
#>
#> Running SVD ...
#>
#> Running Tangent on autosomes and chrX ...
#> Done.
#>
#> Running Tangent on male chrY ...
#> Done.
plot_signal_along_loci(tangent_res, "tumor.female2", example_pif,
                       example_tsig_df, n_latent = n_latent)